- Research
- Open access
- Published:
Green chemometric-assisted UV-spectrophotometric methods for the determination of favipiravir, cefixime and moxifloxacin hydrochloride as an effective therapeutic combination for COVID-19; application in pharmaceutical form and spiked human plasma
BMC Chemistry volume 18, Article number: 65 (2024)
Abstract
As pharmaceutical analysis progresses towards environmental sustainability, there is a growing need to enhance the safety and health conditions for analysts. Consequently, the incorporation of chemometrics into environmentally friendly analytical methods represents a promising approach. Favipiravir, cefixime, and moxifloxacin hydrochloride have been currently used in COVID-19 treatment. In this study, we develop spectrophotometric methods depending on chemometric based models to measure the levels of favipiravir, cefixime, and moxifloxacin hydrochloride in pharmaceutical preparations and spiked human plasma. It is challenging to determine favipiravir, cefixime, and moxifloxacin simultaneously because of overlap in their UV absorption spectra. Two advanced chemometric models, partial least square (PLS) and genetic algorithm (GA), have been developed to provide better predictive abilities in spectrophotometric determination of the drugs under study. The described models were created using a five-level, three-factor experimental design. The outcomes of the models have been thoroughly assessed and interpreted, and a statistical comparison with recognized values has been taken into consideration. The analytical eco-scale and the green analytical procedure index (GAPI) evaluation methods were also utilized to determine how environmentally friendly the mentioned models were. The outcomes demonstrated how well the models described complied with the environmental requirements.
Introduction
The coronavirus disease 2019 (COVID-19) outbreak has become a worldwide crisis due to the devastation it has caused and its rapid spread [1]. This disease is brought on by a novel infectious positive single-stranded RNA virus called SARS-CoV2, and it frequently comes with multiple cases of atypical pneumonia. Although there has been quick progress in developing SARS-CoV-2 vaccines, drug repurposing is still a crucial part of treating various illnesses [2]. Antivirals and antibiotics are mainly used in COVID-19 treatment. Favipiravir (FPV), Fig. 1a is a pyrazine carboxamide derivative. It is an analogue of purine nucleic acid that replaces guanine or adenine and hinders viral replication by preventing RNA-dependent RNA polymerase (RdRp). It is administered as a prodrug that, when phosphoribosylated intracellularly, can produce the active compound FPV ribofuranosyl-5B-triphosphate [3]. For the quantitative determination of FPV, various analytical approaches were reported, including liquid chromatographic [4,5,6,7,8,9,10], electrochemical [11,12,13,14], spectrophotometric [15,16,17], spectrofluorometric [6, 18] and densitometric [19, 20] methods.
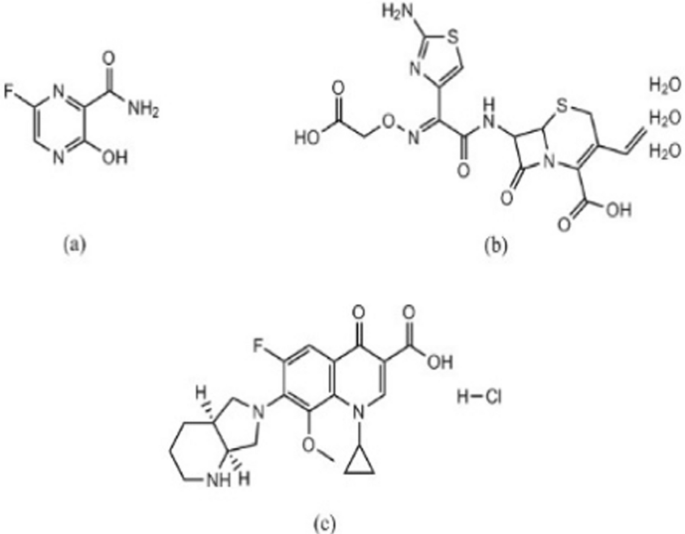
Structural formula of FPV (a), CEF (b) and MFX (c)
Antibiotics are used to treat bacterial infections that coexist with COVID-19 infections or to exploit their possible antiviral properties. Cefixime trihydrate (CEF), Fig. 1b, is a semi-synthetic cephalosporin antibiotic of third-generation that is taken orally. It is an antibacterial agent that is used to treat bronchitis, and pneumonia. Cefixime’s antibacterial effect is due to its ability to prevent the formation of mucopeptides in the bacterial cell wall [21].
Moxifloxacin hydrochloride (MFX), Fig. 1c, is a fourth generation fluoroquinolone antibiotic. Its mechanism of action relies on inhibition DNA gyrase, also known as topoisomerase II, an enzyme that is necessary for the replication of bacterial DNA [22]. The combination of MFX and CEF has been approved by the FDA [23]. So, this combination can be used as adjuncts therapy in treating patients who have COVID-19. A survey of the literature indicates that the most popular analytical method for CEF/MFX analysis is high-performance liquid chromatography (HPLC) [24,25,26]. Nevertheless, the documented HPLC techniques have certain drawbacks, such as the unusual use of potentially harmful organic solvents in the mobile phase as acetonitrile as well as laborious separation processes. Additionally, choosing the right stationary and mobile phases is one of the crucial factors that needs to be precisely adjusted for the best peak resolution. On the other hand, spectrophotometric methods for drug analysis can eliminate the aforementioned issues with increased ease, effectiveness, and precision. Available spectrophotometric techniques used for CEF/MFX determination include mathematical manipulation techniques like first derivative, and first derivative of the ratio spectra [23, 27]. These techniques have drawbacks as well, such as inefficient data collection that could lower the throughput of analytical methodology. These approaches also have drawbacks since they are ineffective at gathering unnecessary data, which could lower the throughput of analytical methodologies due to wasteful data collection. Furthermore, when a data spectrum is analyzed using only one or two points, these methods are extremely sensitive to interfering factors because it is challenging to discern the analyte signal from an interferent. Moreover, every drug needs a calibration curve, and a number of tests are needed to choose the appropriate divisor for the next derivative of the ratio spectra [28, 29]. As a result, chemometrics has garnered a lot of interest lately as a successful post-processing method that can address the aforementioned drawbacks [30]. Partial least squares (PLS) and genetic algorithm partial least squares (GA-PLS) were popular two assisted chemometric spectrophotometric methods for the quantitative analysis of complex mixtures without any recommended need for a prior separation [31, 32].
In addition, no method for simultaneously evaluating FPV, CEF and MFX in co-formulation as co-administered drugs has been reported. This means that hospitalized inpatients require a method to determine those medications simultaneously in order to evaluate their therapeutic drug monitoring [33]. The aim of this study is to develop and validate two new multivariate chemometric methods (PLS and GA-PLS) for the simultaneous analysis of the cited drugs in bulk powder, pharmaceutical dosage forms and spiked human plasma. Also, this study aims to develop the first analytical method capable of estimating those co-administered drugs in the co-formulation while taking into consideration green analytical chemistry concepts. Several tools, including the analytical eco-scale [34] and the green analytical procedure index [35] were used to assess the models' level of greenness. Also, the models given showed superiority with the greenness characteristics in terms of the conventional green metric values. Through the integration of chemometric tools and their application with green assessment metrics, the authors aim to offer a promising challenge for accomplishing green goals.
Experimental
Chemicals
FPV (99.65%) pure powder was kindly supplied by Biophore India Pharmaceuticals Private Limited (Telangana, India). (CEF) (99.50%) pure powder was graciously donated by Kahira Pharmaceutical and Chemical Industrial Company-Cairo-Egypt. MFX (99.45%) pure powder was graciously donated by EVA Pharmaceutical Industrial Company (Cairo, Egypt). All of the chemicals were of analytical grade, the solvents were HPLC grade, and the water was freshly distilled throughout the entire process.
Favipiravir® Tablet (400 mg FPV/Tablet), manufactured by ZHEJIANG HISUN Pharmaceutical Company (batch number 23006020), was purchased from the Chinese market. Moxinow® Tablet (400 mg CEF & 400 mg MFX/Tablet) manufactured by Lupin Ltd (batch number 005G23OS), was purchased from the Indian market.
Apparatus and software
A UV-1800 PC double-beam Shimadzu UV–Vis spectrophotometer, with UV probe software, was utilized. PLS and GA were implemented in MATLAB R2015a (8.5.0.197613) employing the PLS toolbox software version 2.1.
Standard solutions
By dissolving 10 mg of each standard in 70 mL of distilled water in separate 100 mL volumetric flasks, and then bringing the volume to 100 mL with distilled water, three distinct stock solutions (100 μg/mL) of FPV, CEF and MFX have been obtained.
Procedures
PLS and GAPLS models design
Arguably, one of the most important steps to improve the likelihood of obtaining representative and instructive data is to plan your experiments well. A partial five-level/three-factor factorial design would have been ideal for creating calibration and validation sets. In the beginning, twenty-five FPV, CEF and MFX mixtures were created and split into calibration and validation sets.
The calibration set was prepared using five concentration levels for each component to produce 13 laboratory-prepared mixtures with various concentrations ranges: 3–7 μg/mL for each of FPV, CEF and MFX.
The design’s central level is 5 μg/mL for each drug. To prevent any overfitting of the created models, a total of twelve combinations of the three medications under study were selected as the validation set. The calibration and validation sets’ concentrations were established using the partial factorial experimental design approach. The results are shown in Table 1.
Application to pharmaceutical preparation
FPV
Ten Favipiravir® tablets (400 mg/tablet) were finely ground and weighted. A precise weight measurement was used to determine the appropriate amount of powder, equivalent to 10 mg of FPV. The powder was then transferred to a 100-mL volumetric flask, and the volume was increased to approximately 70 mL using distilled water. After 15 min of vigorous shaking and filtration, the volume was filled with distilled water until a volumetric concentration of 100 μg/mL was achieved.
CEF and MFX
Ten Moxinow® Tablet (400 mg CEF & 400 mg MFX/Tablet) were finely ground and weighted. A precise weight measurement was used to determine the appropriate amount of powder, equivalent to 10 mg of FPV. The powder was then transferred to a 100-mL volumetric flask, and the volume was increased to approximately 70 mL using distilled water. After 15 min of vigorous shaking and filtration, the volume was filled with distilled water until a volumetric concentration of 100 μg/mL was achieved.
Favipiravir, cefixime and moxifloxacin hydrochloride (co-formulated)
The fixed-dose combination was formulated because FPV, CEF, and MFX fixed-dose tablets were not readily available. Ten Tablets of each pharmaceutical preparation including Favipiravir® tablets (400 mg/tablet) and Moxinow® tablets (400 & 400 mg/tablet) were weighted, finely powdered and mixed well and calculating the average weight has been done. We weighed amount of powder containing (10 mg for FPV, 10 mg for CEF and 10 mg for MFX) and transferred it to a 100-mL volumetric flask, after which the volume was diluted with distilled water to approximately 70 mL. After 15 min of vigorous shaking, the volume was completed to 100 mL with distilled water and then filtered to obtain a concentration of (100 μg for FPV, 100 μg for CEF and 100 μg for MFX per mL). Using the proposed methods, the FPV, CEF, and MFX contents were determined.
Procedure for determination of FPV, CEF and MFX in spiked human plasma
Various aliquots (0.3, 0.4, 0.5, 0.6, 0.7 mL) of FPV, CEF and MFX standard solutions (100 μg/mL) were pipetted and transferred to 10 mL centrifuge tubes that already contained 1 mL of drug-free plasma. Then, add 3 mL of methanol to denaturate the protein. After mixing the contents of centrifuge tubes with a vortex shaker, the tubes were centrifuged for 30 min at 4000 rpm. The resulting protein-free supernatants were evaporated to dryness using a rotary evaporator under vacuum, then reconstituted in distilled water, placed in 10-mL volumetric flasks, and then the volume was diluted to 10 mL with distilled water. For each drug, the overall method was repeated with aliquots encompassing the working concentration range. Using the proposed methods, the FPV, CEF, and MFX contents were determined.
Results and discussion
Spectral characteristics
The FPV, CEF and MFX UV spectral characteristics were measured between 200 and 400 nm in wavelength. After taking a quick look at these spectra, Fig. 2 illustrates a severe overlap that explains the difficulty in directly determining that drugs simultaneously. Thus, we utilized two chemometric assisted calibration methods, namely PLS and GA-PLS, to address such overlap and determine FPV, CEF and MFX concurrently in their pharmaceutical dosage form and spiked human plasma.

Absorption spectra of 5 μg/mL FPV, 5 μg/mL CEF and 5 μg/mL MFX
PLS and GA-PLS
The spectral matrix of the calibration data was fitted with the PLS model, a popular regression model, to infer it into new dimensions known as latent variables (LVs). PLS model was used to design a calibration model between the concentration of the studied drugs and the latent variables of the data matrix. Its ability to use all of the information in the recorded spectral data ensures greater accuracy for the spectral analysis. Additionally, PLS model has the advantage of choosing the most informative variables and excluding the uninformative ones which improves the quality of the applied model. A calibration set of 13 calibration spectra was used in conjunction with the cross validation approach, which involves removing samples one at a time, to determine the number of factors in the PLS algorithm. Consequently, the root-mean-square error cross-validation (RMSECV) was calculated after a series of LVs were gradually added to the model. Using Haaland and Thomas’s criteria [36], the best number of latent variables was chosen. The model with the best latent variable shows no statistically significant difference the corresponding root mean squares error of cross-validation and the minimum root mean squares error of cross-validation.
As shown in Fig. 3, it was discovered that two latent variables were optimal for FPV and three latent variables for CEF and MFX with RMSECV values of 0.110, 0.160 and 0.111, respectively.

Cross validation results of the full PLS models for A FPV, B CEF, C MFX and the GA-PLS models for D FPV, E CEF, F MFX. The optimum number of latent variables shows significant decrease in their RMSECV values
Fascinatingly, the GA procedure was employed as an informative variable’s selection technique in order to increase the PLS model’s predictive ability. To eliminate irrelevant variables while retaining informative ones, the GA model was applied to 201 variables for FPV, CEF and MFX (200–400 nm). A key factor in achieving successful GA performance is the modification of GA parameters, as indicated in Table 2. When using GAs, one of the most important factors is the population size. Choosing the right population size is an intricate issue. Larger population sizes are able to search larger spaces, which leads to an early convergence to the solution, while smaller populations perform poorly due to their limited ability to search the solution space [37]. Another crucial feature of GA was its rate of mutation, which changed one or more GA chromosomes’ genes to maintain the diversity of genetic populations and impede rapid convergence. It was discovered that the appropriate mutation rate for every medication was 0.005. Other parameters are the maximum number of LVs using the full PLS model, the number of subsets, and the number of cross-validation iterations at each generation were also estimated. Fascinatingly, it was discovered that GA reduces the absorbance matrix to roughly 33% for FVP, 25% for CEF and 23% for MFX (66 variables for FVP, 50 variables for CEF and 46 for MFX). As indicated in Tables 3 and 4, it is interesting to note that the GA-PLS models for the three drugs have lower values in terms of standard deviation (SD) of the % recoveries when compared to the full model.
Models validation
The models described was validated regarding to linearity range, accuracy, precision, limits of detection (LOD), limits of quantitation (LOQ) and selectivity parameters.
Range of linearity
Regarding the developed PLS experimental design, which took into account the concentration range of 1–15 μg/mL for FPV, 2–15 μg/mL for CEF and 1–10 μg/mL for MFX, acceptable results were obtained over this range. While the concentration range of 1–15 μg/mL for FPV, 1–15 μg/mL for CEF and 0.5–10 μg/mL for MFX shows acceptable results for the developed GA-PLS experimental design, as indicated in Table 5.
Limits of detection and quantitation
LOD and LOQ were calculated, and the results were listed in Table 5. The results demonstrated the sensitivity of the proposed model for drug analysis.
Accuracy and precision
The proposed procedure was used to determine three concentration levels in triplicate that covered the linearity ranges of the three drugs (4, 5, and 6 μg/mL for each drug). The method's precision, calculated as %RSD, was evaluated by using the proposed procedure for triplicate determination of three concentration levels that covered the linearity range of each drug (4, 5, and 6 μg/mL for each drug) within one day for repeatability and on three consecutive days for intermediate precision. Excellent %R, as displayed in Table 5, proves the proposed method’s accuracy. Additionally, small RSD values, as displayed in Table 5, prove the high method’s precision. Also, a variety of validation parameters, such as root mean square error of calibration (RMSEC), root mean square error of prediction (RMSEP), and relative root mean square error of prediction (RRMSEP), had been computed and displayed in Table 5 in order to interpret the accuracy and predictive ability of the models. Additionally, the precision or variance of the prediction was measured using the bias corrected mean square error of prediction (BCMSEP) parameter (Table 5), and the best outcomes were obtained.
Selectivity
The standard addition technique on the already analyzed pharmaceutical samples, Table 6, was also used to assess the effect of excipients on estimation of the drugs. According to Table 7, the results obtained by application of the standard addition technique demonstrate the selectivity of the method in avoiding interference from excipients.
Application of the proposed models for determination of FPV, CEF and MFX pharmaceutical dosage forms
To compare the outcomes with those of the reported methods, statistics were used [23]. As shown in Table 8, the proposed approach for analyzing the drug under investigation in its pharmaceutical dosage form did not produce any statistically significant differences when the student’s t-test and the F-test were conducted at a 95% confidence level. This suggests that the suggested method is accurate and precise.
Determination of FPV, CEF and MFX in spiked human plasma
The new method was successful in monitoring FPV, CEF and MFX at therapeutic levels in spiked human plasma samples because the proposed models’ linearity and detection limits, along with the mean plasma Cmax values for FPV (12.69–41.39 μg/mL), CEF (4.7263 ± 1.2069 μg/mL) and MFX (3.56 mg/L) [38,39,40], allowed for this degree of determination. As shown in Table 9, the models discussed were appropriate for determining the drugs under study in human plasma without interfering with endogenous plasma matrix components.
Green assessment of the described models
Two new approaches to assessing the greenness of the suggested method were presented: the analytical eco-scale [34, 41] and the green analytical procedure index. The eco-scale relies on penalization points calculated from reagents, instruments, and waste to facilitate their development as semi-quantitative methods. The method relies on subtracting the total number of penalty points from 100. The higher the value of the result, the more environmentally friendly the newly developed approach [35]. In Table 10, the sum of the penalty points for the suggested technique were 3 and 9 points for application of Pharmaceutical dosage forms and Spiked human plasma, respectively that resulted a total scoring of 91 and 97. This shows that the suggested approach is just as environmentally friendly as the reported spectrophotometric method for CEF and MFX [23], but it is more environmentally friendly than the reported techniques for favipiravir [10, 42]. Using five pictograms and a unique symbol, the GAPI metrics rate how environmentally friendly each stage of the analytical process is. Every pictogram is made up of different fields and denotes a specific stage in an analytical procedure. The environmental effects of each field are classified as low, medium, and high (green, yellow, and red), and their corresponding quantities are computed. Furthermore, a specific circle indicates whether or not the approach being studied includes quantification [35].
The described models for the proposed method had nine and seven green zones for application in pharmaceutical dosage forms and spiked human plasma, respectively. This indicates the proposed model has the same greenness as the previously reported spectrophotometric method for CEF and MFX [23]. Comparing with other reported methods of favipiravir, the proposed method has more green zones with the same number of red zones when applied in the same matrix. In conclusion, the green metrics' findings provided a thorough environmental friendliness profile and, for the most part, verified compliance with green practices.
Conclusion
In the proposed study, two novel multivariate chemometric methods were used to validate a new analytical tool for the simultaneous determination of FPV, CEF and MFX in pharmaceutical preparations and spiked human plasma. Without requiring a separation step, the chemometric techniques under study demonstrated excellent sensitivity and resolving power. This in turn provides more economical alternatives, higher levels of simplicity, and faster analysis times all of which are necessary for the numerous regular daily analyses that pharmaceutical research and quality control laboratories perform. To enable integrated green spectrophotometric determination of the drugs under study, chemometric models were built and refined. The Green Analytical Procedure Index, and the analytical eco-scale were used to assess the greenness of the models. In terms of the official green metric values, the results demonstrated that the models described complied and met the environmental friendliness requirements.
Availability of data and materials
The datasets used and/or analyzed during the current study are available from the corresponding author on reasonable request.
Abbreviations
- FPV:
-
Favipiravir
- CEF:
-
Cefixime trihydrate
- MFX:
-
Moxifloxacin hydrochloride
- PLS:
-
Partial least squares
- GA:
-
Genetic Algorithm
- ICH:
-
International Conference on Harmonization
- GAPI:
-
Green Analytical Procedure Index
References
Yang L, Liu S, Liu J, Zhang Z, Wan X, Huang B, Chen Y, Zhang Y. COVID-19: immunopathogenesis and immunotherapeutics. Signal Transduct Target Ther. 2020;5:128. https://doi.org/10.1149/10701.17797ecst.
Chakraborty C, Sharma AR, Bhattacharya M, Agoramoorthy G, Lee S-S. The drug repurposing for COVID-19 clinical trials provide very effective therapeutic combinations: lessons learned from major clinical studies. Front Pharmacol. 2021;12: 704205. https://doi.org/10.3389/fphar.2021.704205.
Hassanipour S, Arab-Zozani M, Amani B, Heidarzad F, Fathalipour M, Martinez-de-Hoyo R. The efficacy and safety of Favipiravir in treatment of COVID-19: a systematic review and meta-analysis of clinical trials. Sci Rep. 2021;11:11022. https://doi.org/10.1038/s41598-021-90551-6.
Bulduk İ. Comparison of HPLC and UV spectrophotometric methods for quantification of favipiravir in pharmaceutical formulations. Iran J Pharm Res IJPR. 2021;20:57. https://doi.org/10.22037/ijpr.2020.114199.14725.
Harahap Y, Noer RF, Simorangkir TPH. Development and validation of method for analysis of favipiravir and remdesivir in volumetric absorptive microsampling with ultra high-performance liquid chromatography–tandem mass spectrophotometry. Front Med. 2023;10:1022605. https://doi.org/10.3389/fmed.2023.1022605.
Mikhail IE, Elmansi H, Belal F, Ibrahim AE. Green micellar solvent-free HPLC and spectrofluorimetric determination of favipiravir as one of COVID-19 antiviral regimens. Microchem J. 2021;165: 106189. https://doi.org/10.1016/j.microc.2021.106189.
Nadendla R, Abhinandana P. A validated high performance liquid chromatographic method for the quantification of favipiravir by PDA detector. Int J Life Sci Pharma Res. 2021;11:181–8. https://doi.org/10.3390/molecules26133789.
Nishanth VG, Spandana T, Sri CD, Nataraj V, Vikram PH, Gurupadayya B. Multivariate optimization for determination of favipiravir, a SARS-CoV-2 molecule, by the reverse-phase liquid chromatographic method using a QbD approach. J Chromatogr Sci. 2022. https://doi.org/10.1093/chromsci/bmac041.
Tiris G, Gazioglu I, Furton KG, Kabir A, Locatelli M. Fabric phase sorptive extraction combined with high performance liquid chromatography for the determination of favipiravir in human plasma and breast milk. J Pharm Biomed Anal. 2023;223: 115131. https://doi.org/10.1016/j.jpba.2022.115131.
Marzouk HM, Rezk MR, Gouda AS, Abdel-Megied AM. A novel stability-indicating HPLC-DAD method for determination of favipiravir, a potential antiviral drug for COVID-19 treatment; application to degradation kinetic studies and in-vitro dissolution profiling. Microchem J. 2022;172: 106917. https://doi.org/10.1016/j.microc.2021.106917.
Ali MF, Saraya RE, El Deeb S, Ibrahim AE, Salman BI. An innovative polymer-based electrochemical sensor encrusted with Tb nanoparticles for the detection of favipiravir: a potential antiviral drug for the treatment of COVID-19. Biosensors. 2023;13:243. https://doi.org/10.3390/bios13020243.
Allahverdiyeva S, Yunusoğlu O, Yardım Y, Şentürk Z. First electrochemical evaluation of favipiravir used as an antiviral option in the treatment of COVID-19: A study of its enhanced voltammetric determination in cationic surfactant media using a boron-doped diamond electrode. Anal Chim Acta. 2021;1159: 338418. https://doi.org/10.1016/j.aca.2021.338418.
El-Wekil MM, Hayallah AM, Abdelgawad MA, Abourehab MA, Shahin RY. Nanocomposite of gold nanoparticles@ nickel disulfide-plant derived carbon for molecularly imprinted electrochemical determination of favipiravir. J Electroanal Chem. 2022;922: 116745. https://doi.org/10.1016/j.jelechem.2022.116745.
Mehmandoust M, Khoshnavaz Y, Tuzen M, Erk N. Voltammetric sensor based on bimetallic nanocomposite for determination of favipiravir as an antiviral drug. Microchim Acta. 2021;188:1–15. https://doi.org/10.1007/s00604-021-05107-2.
Chakraborty S, Mondal S. Green eco-friendly analytical method development, validation, and stress degradation studies of favipiravir in bulk and different tablet dosages form by UV-spectro-photometric and RP-HPLC methods with their comparison by using ANOVA and in-vitro dissolution studies. Int J Pharm Investig. 2023. https://doi.org/10.5530/ijpi.13.2.039.
Panchale WA, Bisen SB, Manwar JV, Bakal RL, Tidke TV, Paithankar MN, Vakhare AG. Development of visible spectrophotometric methods for the analysis of favipiravir in pure drug and tablet formulation. GSC Biol Pharm Sci. 2022;20:184–95. https://doi.org/10.30574/gscbps.2022.20.2.0320.
Rele RV, Tiwatane PP. Simple extractive spectrophotometric method for determination of favipiravir from pharmaceutical formulation. Asian J Res Chem. 2022. https://doi.org/10.52711/0974-4150.2022.00053.
Megahed SM, Habib AA, Hammad SF, Kamal AH. Experimental design approach for development of spectrofluorimetric method for determination of favipiravir; a potential therapeutic agent against COVID-19 virus: application to spiked human plasma. Spectrochim Acta Part A Mol Biomol Spectrosc. 2021;249: 119241. https://doi.org/10.1016/j.saa.2020.119241.
Balap AR, Dudhe AP. Stability indicating HPTLC method development and validation for quantification of favipiravir in bulk and commercial film coated tablet. Int J Pharm Investig. 2023. https://doi.org/10.5530/ijpi.13.3.071.
Jain B, Jain R, Jaiswal PK, Zughaibi T, Sharma T, Kabir A, Singh R, Sharma S. A non-instrumental green analytical method based on surfactant-assisted dispersive liquid–liquid microextraction–thin-layer chromatography–smartphone-based digital image colorimetry (SA-DLLME-TLC-SDIC) for determining favipiravir in biological samples. Molecules. 2023;28:529. https://doi.org/10.3390/molecules28020529.
Hooper DC, Wolfson JS. Mechanisms of quinolone action and bacterial killings, quinolone antimicrobial agents, vol 1, 2nd edn. Washington, DC: American Society for Microbiology 1993; pp. 53–57
Hooper DC, Jacoby GA. Topoisomerase inhibitors: fluoroquinolone mechanisms of action and resistance. Cold Spring Harb Perspect Med. 2016;6:a025320.
Attimarad M, Al-Dhubiab BE, Alhaider IA, Nair AB, Sree HN, Mueen AK. Simultaneous determination of moxifloxacin and cefixime by first and ratio first derivative ultraviolet spectrophotometry. Chem Central J. 2012;6:1–7. https://doi.org/10.1186/1752-153X-6-105.
Devika G, Sudhakar M, Rao JV. Simultaneous estimation of cefixime and moxifloxacin in bulk and its pharmaceutical dosage form by RP-HPLC. Orient J Chem. 2012;28:1743–50.
Chauhan RS, Chabhadiya MB, Patel AK, Shah SA. Simultaneous estimation of cefixime trihydrate and moxifloxacin hydrochloride in their combined tablet dosage form by RPHPLC. J Der Pharma Chemica. 2013;5:197–201.
Rao A. Development and validation of novel HPLC method for simultaneous estimation of cefixime and moxifloxacin in combined tablet dosage form. Int J Pharm. 2013;3:621–7.
Patel M, Kakadiya J, Shah N. Development and validation of first order derivative spectrophotometric method for simultaneous estimation of cefixime trihydrate and moxifloxacin hydrochloride in combined tablet dosage form. Asian J Pharm Sci Thechnol. 2013;3:19–24.
Fayez YM, Tawakkol SM, Fahmy NM, Lotfy HM, Shehata MA-A. Comparative study of the efficiency of computed univariate and multivariate methods for the estimation of the binary mixture of clotrimazole and dexamethasone using two different spectral regions. Spectrochim Acta Part A Mol Biomol Spectrosc. 2018;194:126–35. https://doi.org/10.1016/j.saa.2018.01.00.
Obaydo RH, Al Zakri DJ, Sakur AA, Lotfy HM. Ultraviolet spectrophotometric methods for the determination of the minor component presented in fixed-dose pharmaceutical combinations through the last two decades (2000–2020). Future J Pharm Sci. 2021;7:1–9. https://doi.org/10.1186/s43094-021-00192-9.
Abdelazim AH, Shahin M. Different chemometric assisted approaches for spectrophotometric quantitative analysis of lesinurad and allopurinol. Spectrochim Acta Part A Mol Biomol Spectrosc. 2021;251: 119421. https://doi.org/10.1016/j.saa.2020.119421.
Brereton RG. Multilevel multifactor designs for multivariatecalibration. Analyst. 1997;122:1521–9.
Yehia AM, Mohamed HM. Chemometrics resolution and quantification power evaluation: application on pharmaceutical quaternary mixture of Paracetamol, Guaifenesin, Phenylephrine and p-aminophenol. Spectrochim Acta Part A Mol Biomol Spectrosc. 2016;152:491–500.
Mahdavi R, Talebpour Z. Analytical approaches for determination of COVID-19 candidate drugs in human biological matrices. TrAC Trends Anal Chem. 2023. https://doi.org/10.1016/j.trac.2023.116964.
Gałuszka A, Migaszewski ZM, Konieczka P, Namieśnik J. Analytical Eco-Scale for assessing the greenness of analytical procedures. TrAC, Trends Anal Chem. 2012;37:61–72. https://doi.org/10.1016/j.trac.2012.03.013.
Płotka-Wasylka J. A new tool for the evaluation of the analytical procedure: green analytical procedure index. Talanta. 2018;181:204–9. https://doi.org/10.1016/j.talanta.2018.01.013.
Haaland DM, Thomas EV. Partial least-squares methods for spectral analyses. 1. Relation to other quantitative calibration methods and the extraction of qualitative information. Anal Chem. 1988;60:1193–202.
Serag A, Hasan MA, Tolba EH, Abdelzaher AM, Elmaaty AA. Analysis of the ternary antiretroviral therapy dolutegravir, lamivudine and abacavir using UV spectrophotometry and chemometric tools. Spectrochim Acta Part A Mol Biomol Spectrosc. 2022;264:120334. https://doi.org/10.1016/j.saa.2021.120334.
Moise P, Birmingham M, Schentag J. Pharmacokinetics and metabolism of moxifloxacin. Drugs Today (Barcelona, Spain: 1998). 2000;36:229–44. https://doi.org/10.1358/dot.2000.36.4.570201.
Zakeri-Milani P, Valizadeh H, Islambulchilar Z. Comparative bioavailability study of two cefixime formulations administered orally in healthy male volunteers. Arzneimittelforschung. 2008;58:97–100. https://doi.org/10.1055/s-0031-1296475.
Gülhan R, Eryüksel E, Gülçebi İdriz Oğlu M, Çulpan Y, Toplu A, Kocakaya D, Tigen E, Ertürk Şengel B, Sili U, Olgun Yıldızeli Ş. Pharmacokinetic characterization of favipiravir in patients with COVID-19. Br J Clin Pharmacol. 2022;88:3516–22. https://doi.org/10.1111/bcp.15227.
Sajid M, Płotka-Wasylka J. Green analytical chemistry metrics: a review. Talanta. 2022;238: 123046. https://doi.org/10.1016/j.talanta.2021.123046.
Elama HS, Zeid AM, Shalan SM, El-Shabrawy Y, Eid MI. Eco-friendly spectrophotometric methods for determination of remdesivir and favipiravir; the recently approved antivirals for COVID-19 treatment. Spectrochim Acta Part A Mol Biomol Spectrosc. 2023;287: 122070. https://doi.org/10.1016/j.saa.2022.122070.
Acknowledgements
Not applicable.
Funding
Open access funding provided by The Science, Technology & Innovation Funding Authority (STDF) in cooperation with The Egyptian Knowledge Bank (EKB). There is no funding to declare.
Author information
Authors and Affiliations
Contributions
EAM: conceptualization, methodology, investigation, writing—original draft. AAE: conceptualization, writing—review & editing, supervision. SME: conceptualization, writing—review & editing, supervision. ASA: conceptualization, writing—review & editing, supervision. All authors read and approved the final manuscript.
Corresponding author
Ethics declarations
Ethics approval and consent to participate
The study was carried out according to the Declaration of Helsinki and approved by Zagazig University Institutional Review Board (ZU-IRB) under the number (ZU-IRB #11330). The need for informed consent was waived by Zagazig University Institutional Review Board (ZU-IRB) as the human plasma was provided kindly by Zagazig University Hospitals. All described procedures were performed in accordance with relevant guidelines and regulations.
Consent for publication
Not applicable.
Competing interests
All authors confirm that there are no competing interests.
Additional information
Publisher's Note
Springer Nature remains neutral with regard to jurisdictional claims in published maps and institutional affiliations.
Rights and permissions
Open Access This article is licensed under a Creative Commons Attribution 4.0 International License, which permits use, sharing, adaptation, distribution and reproduction in any medium or format, as long as you give appropriate credit to the original author(s) and the source, provide a link to the Creative Commons licence, and indicate if changes were made. The images or other third party material in this article are included in the article's Creative Commons licence, unless indicated otherwise in a credit line to the material. If material is not included in the article's Creative Commons licence and your intended use is not permitted by statutory regulation or exceeds the permitted use, you will need to obtain permission directly from the copyright holder. To view a copy of this licence, visit http://creativecommons.org/licenses/by/4.0/. The Creative Commons Public Domain Dedication waiver (http://creativecommons.org/publicdomain/zero/1.0/) applies to the data made available in this article, unless otherwise stated in a credit line to the data.
About this article

Cite this article
Madbouly, E.A., El-Shanawani, A.A., El-adl, S.M. et al. Green chemometric-assisted UV-spectrophotometric methods for the determination of favipiravir, cefixime and moxifloxacin hydrochloride as an effective therapeutic combination for COVID-19; application in pharmaceutical form and spiked human plasma. BMC Chemistry 18, 65 (2024). https://doi.org/10.1186/s13065-024-01168-5
Received:
Accepted:
Published:
DOI: https://doi.org/10.1186/s13065-024-01168-5